Select the Event Status Overview from the Dashboards menu and then set the time frame using the timeframe selector on the top right. 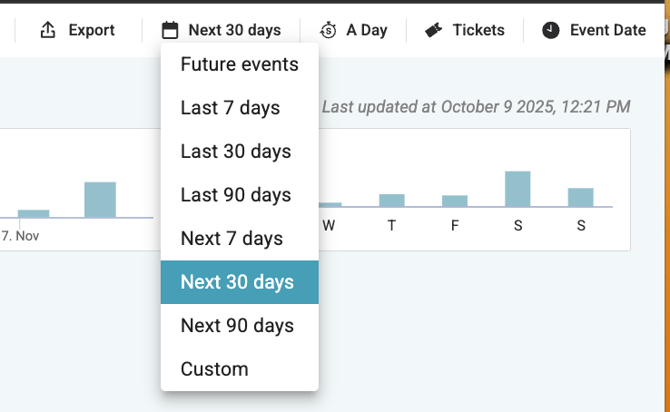
The graphs on the top of this dashboard should be familiar. They can be filtered as they can on other dashboards.
Past the graphs is an overview of events within the selected dates. 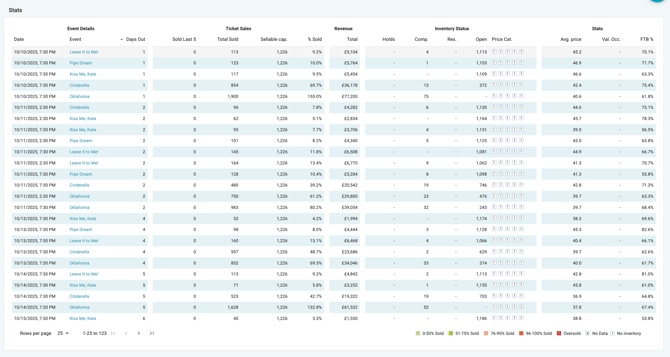
This chart allows for quick visibility into performances and events needing more attention.
Sort the columns by ascending or descending order by clicking the header on each column.
This chart answers questions, such as:
Sort the columns by ascending or descending order by clicking the header on each column.
This chart answers questions, such as:
- "Are we reaching our target value occupancy overall?"
- "How are sales generally for specific event categories, ticket types etc?"
- "Do we have any low-performing events or categories?"
Add additional filters to this chart by selecting items in the graphs above. For example, select a specific category in the Categories graph, and the table contents will shift to show events inside that category only.