Sales Overview provides an overview of sales for a specific period (the default is the last 7 days), showing key figures and top-selling events as well as breakdowns of ticket sales by key dimensions.
Customer Overview provides an overview of customers for a specific period (the default is the last 30 days), showing key figures and top customer trends.
Customer Overview provides an overview of customers for a specific period (the default is the last 30 days), showing key figures and top customer trends.
Customize the Search
You can use the filters in the top banner to tailor the dashboard to your search.
KPIs
Key Performance Indicators (KPIs) are the metrics at the top of the dashboard that synthesise information related to performance within the chosen date range.

Check Your Top Events with Sales Overview
On the left of the dashboard, the Top Events column will show the best-selling performances in the selected period. Click the event title to open a page with information about that performance, and you will be directed to the Performance View page.
The possibility to sort them by Tickets sold or Revenue made helps you personalize the dashboard based on your main focus.
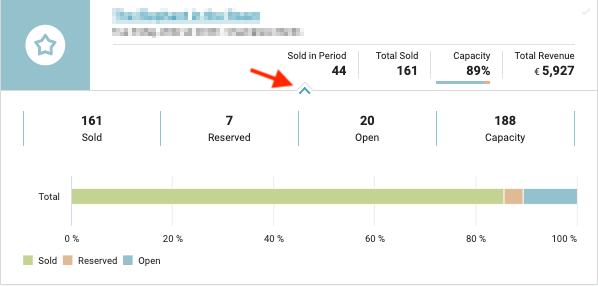
In the list of events, each event has a quick overview of the sales made by week and the ticket sold, also divided by price category. To be able to access the quick overview, click on the arrow at the bottom of the box:
In the list of events, each event has a quick overview of the sales made by week and the ticket sold, also divided by price category. To be able to access the quick overview, click on the arrow at the bottom of the box:
Check Your Top Customers with Customer Overview
On the left of the dashboard, the Top Customers column will show the customers who spend the most in the selected period. Click the customer name to open a page with information about that customer, and you will be directed to the Customer View page.The possibility to sort them by Tickets sold or Revenue made helps you personalize the dashboard based on your main focus.
What is the source of the data I see?
All data we display in your Activity Stream platform are coming from your Ticketing platform.
We do not generate any data, so we are not able to combine elements and create new information. If there is no information in a particular graph, we are not recieving that information from your ticketing system.
If the data here does not match with the one in your Ticketing Platform, please contact us at support@activitystream.com.