What is Activity Stream?
Activity Stream is a real-time analytics platform that takes transactional data from your ticketing platform, combines it with data from other sources, and uses it to build a live, interactive dashboard that you can use to explore your data. For more information, check out Activity Stream’s website.
Characteristics
Real-time - Depending on your ticketing platform our data refreshes between real-time and once per day.
Adaptive - Every time you add a filter or exclude a value, the URL of the platform changes, so you can easily copy/paste the URL to your colleague and they can see what you saw. This means you can also bookmark various pages and see them with the same filters the day after.
Level of detail - There are a lot of features on Activity Stream, a lot of them almost hidden at first sight (like the 6 buttons on every component which allow you to deselect specific elements, or download the graph).
Basics to get around
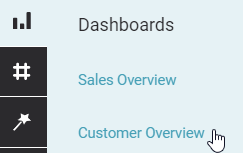
Dashboards
Top bar
You can use the other icons and dropdowns to:
- Change the date range of the data that you are looking at (Calendar Icon)
- Export a CSV of the audience or a PDF of the dashboard (Export)
- If you expand the date range, the Stopwatch Icon changes the granularity of the graphs into 7 day, monthly, or yearly breakdowns